The Blog · Since 2011
Chart Addict
Where the charts do the talking.
I've been charting markets for nearly 20 years — from the prop desk in Scottsdale to holding longer and longer on the weekly charts. I work top-down: monthly for the big picture, weekly for the trend, daily for entries.
Here you'll find my charts of interest, setups and notes on stocks, indices and crypto, plus 15 years of archives.
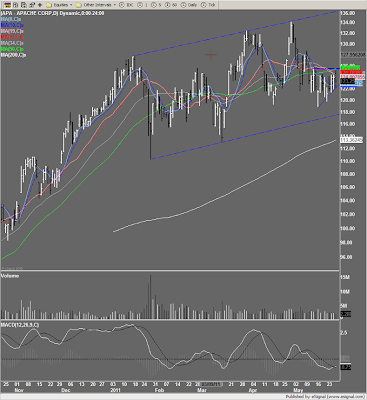
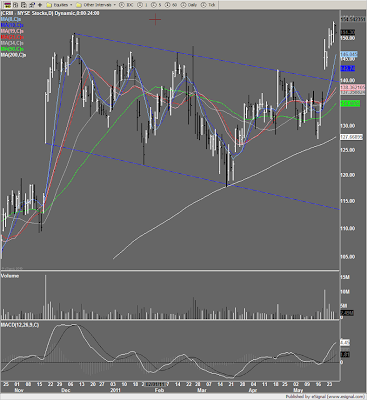
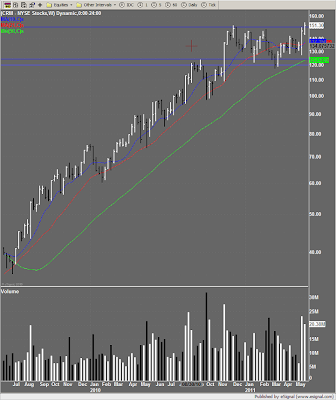
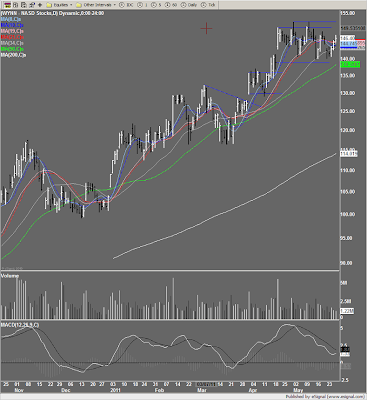
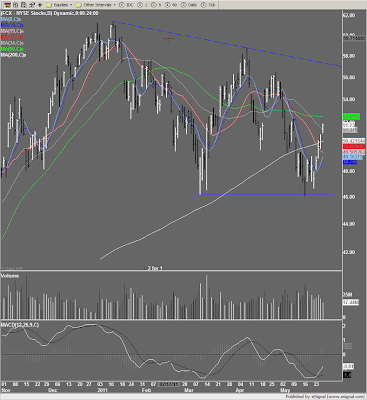


$FCX Ripping thru 50dma
FCX breaking out from this descending channel. Looking great and ready to retest recent highs around 61.50. Near term measured move is to 61.50 and longer term to about 80.00 +/-

On the 30 minute chart you can see the double bottom near 46.00 and the volume ramp showing demand at 46-47 level as well as volume ramping as it cleared 53.50.


On the 30 minute chart you can see the double bottom near 46.00 and the volume ramp showing demand at 46-47 level as well as volume ramping as it cleared 53.50.

I absolutely believe that price movement patterns are being repeated. They are recurring patterns that appear over and over, with slight variations. This is because markets are driven by humans -- and human nature never changes. - J.L.