Charts of Interest - Weekly Perspective
Follow @JFDI
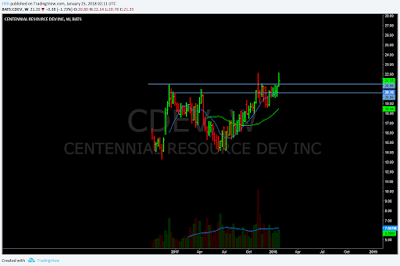
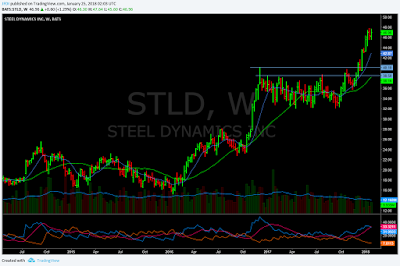
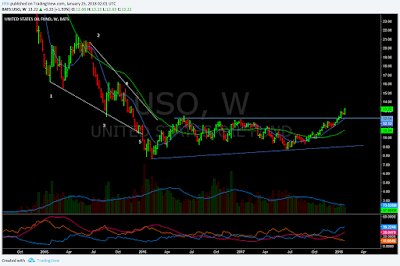
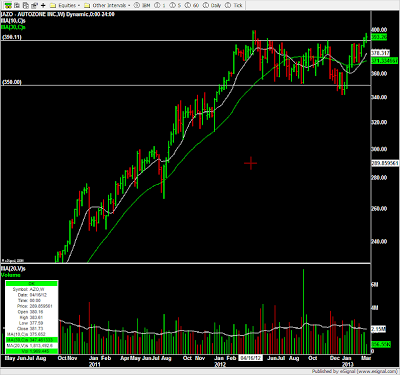
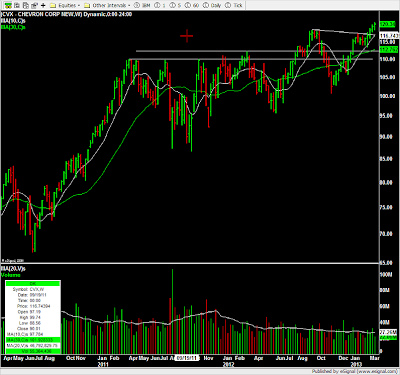
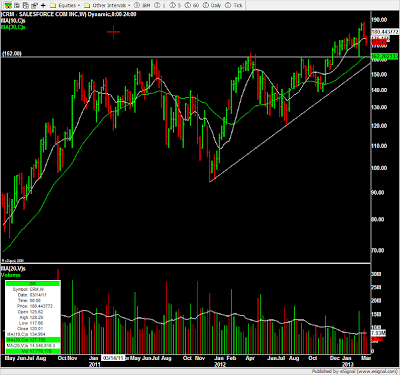
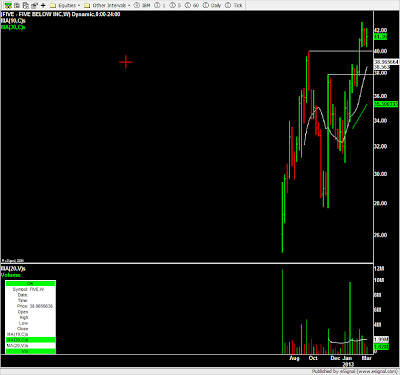
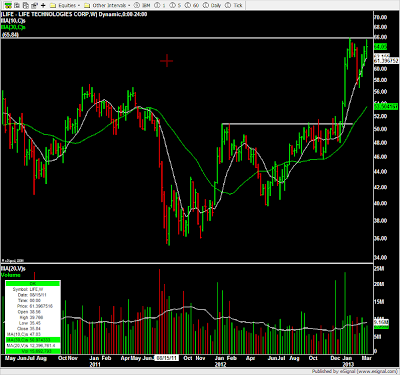
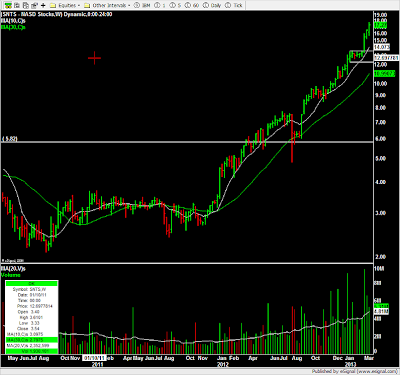
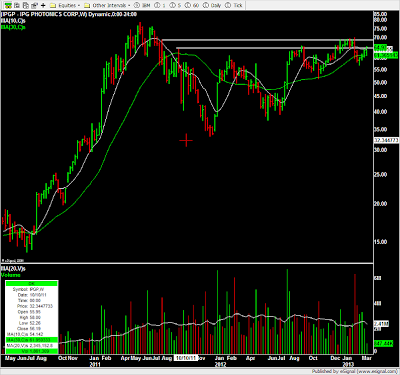
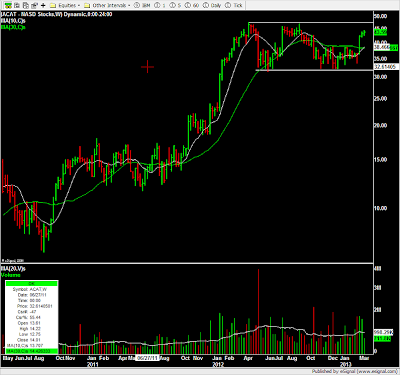
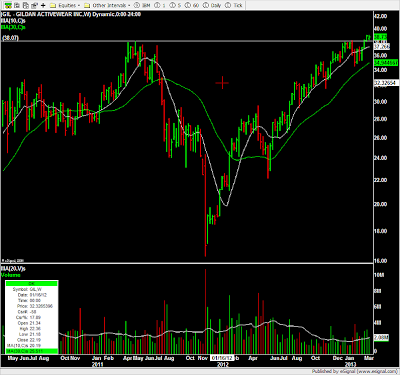
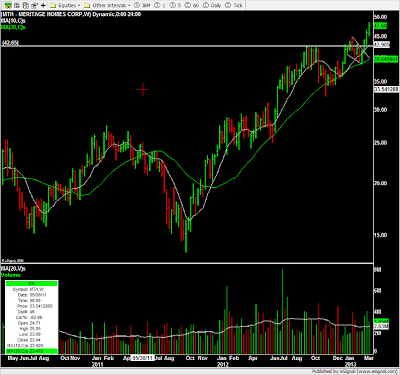
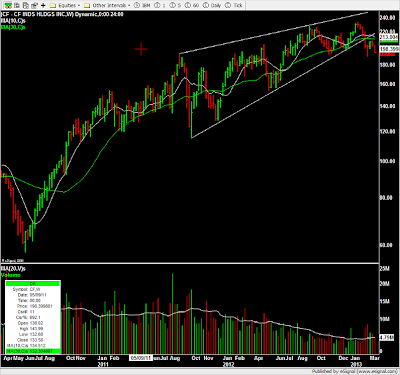
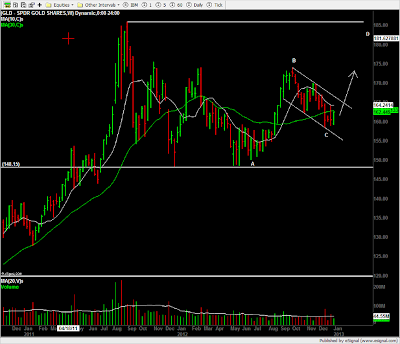
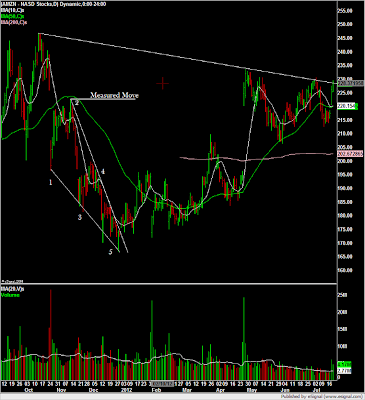
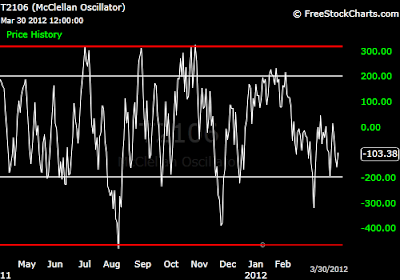
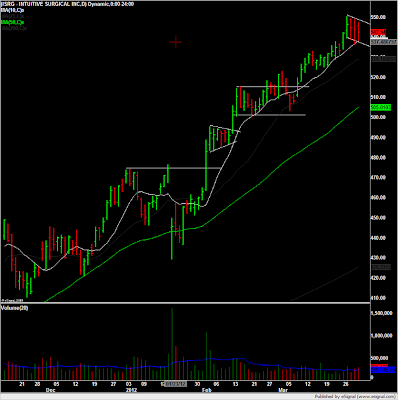
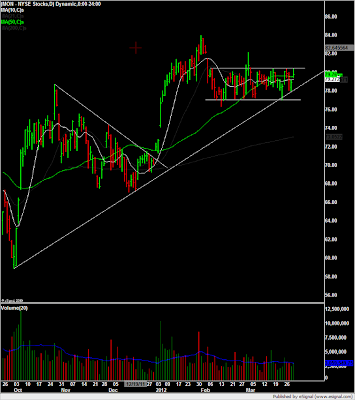
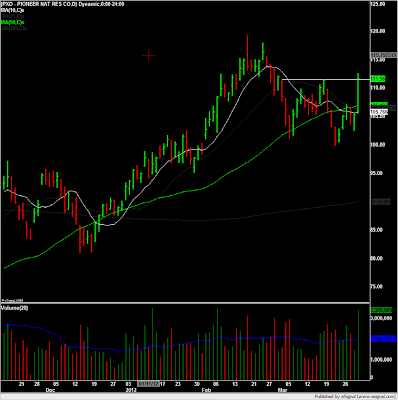
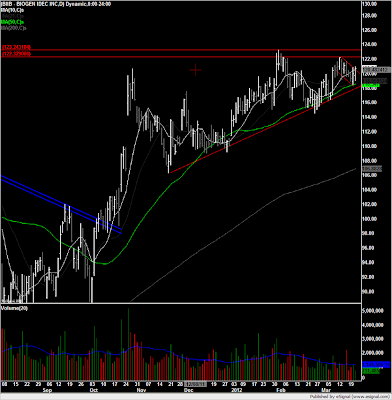
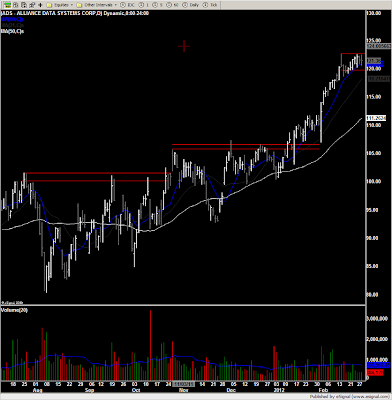
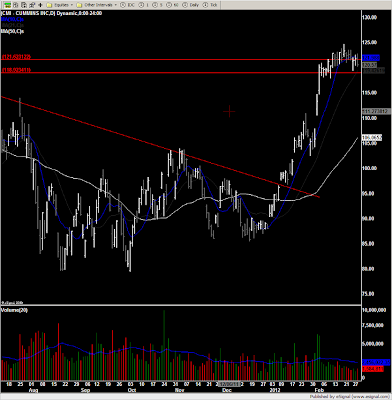
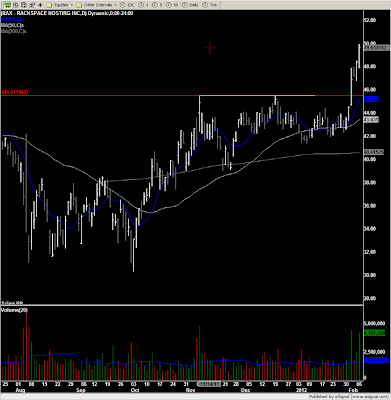
A lot of stocks on the Market Smith Growth 250+ list have made runs of 20%-100% since the beginning of this intermediate up trend that began on on the low of 11/16/12 and really got moving on 12/31/12. For me, just because the Indexes are starting to act sloppy and erratic doesn't mean I am hoping on the short side and I am not cutting my longs either. This is one of those times where less is more. I have taken profits in most of my winning positions and down to core size in each. Trails stops set in what I have left.
This is just a list of names that have come across my scans. I continually watch for names that hold up well in corrective and choppy markets.
"Plan your trades and trade your plan."
SSYS & DDD
3 Open Positions - Stopped Out of the Rest
Follow @JFDI
Recently -
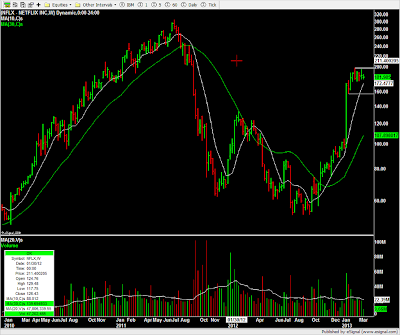
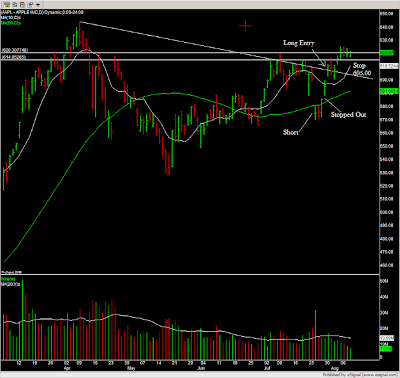
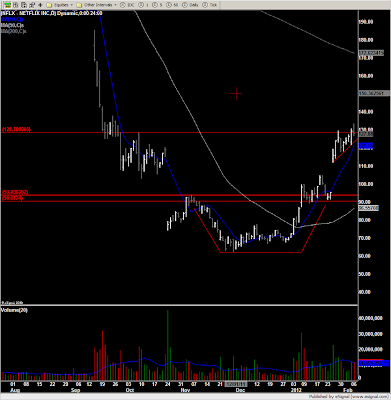
Trail stop hit on NFLX short for a small gain.
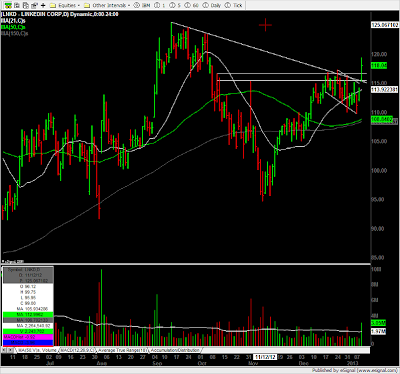
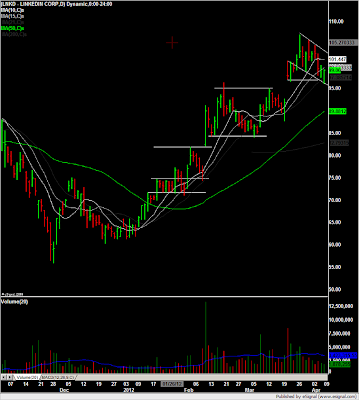
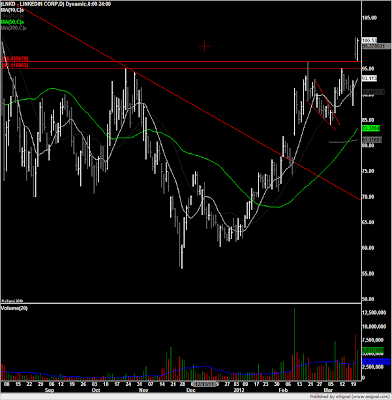
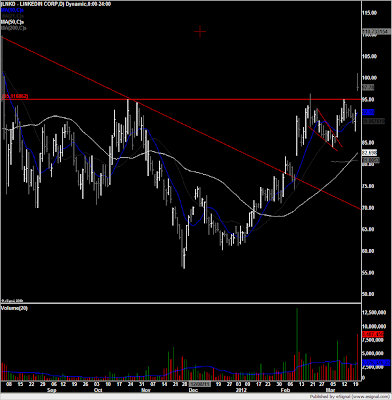
Stopped out of LNKD for a loss.
Recently -
Trail stop hit on NFLX short for a small gain.
Stopped out of LNKD for a loss.


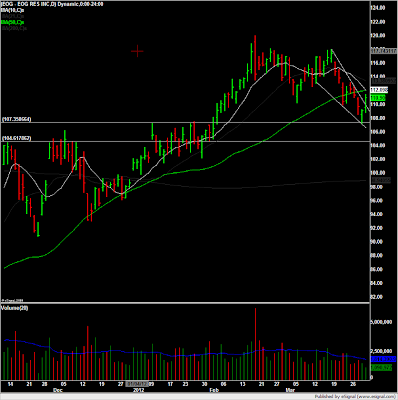


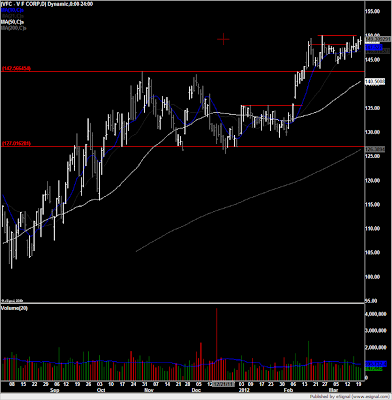

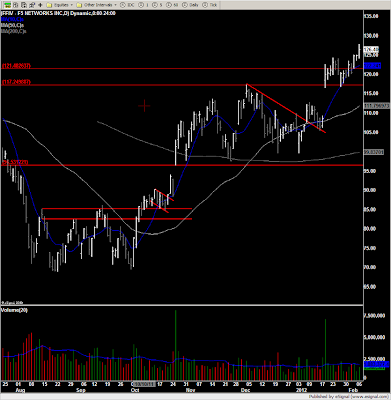
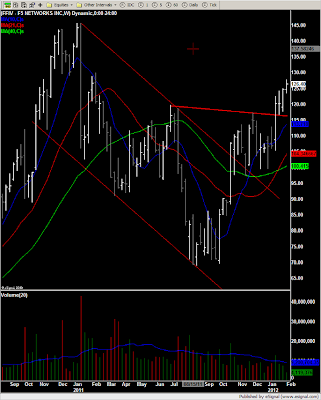


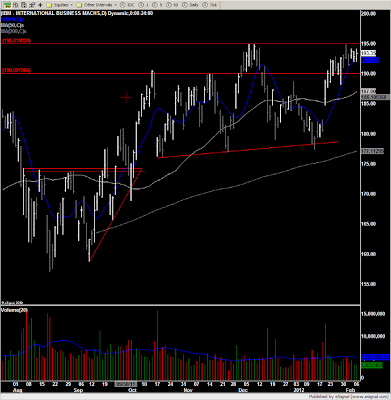

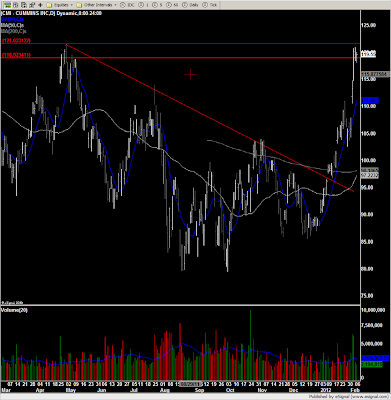

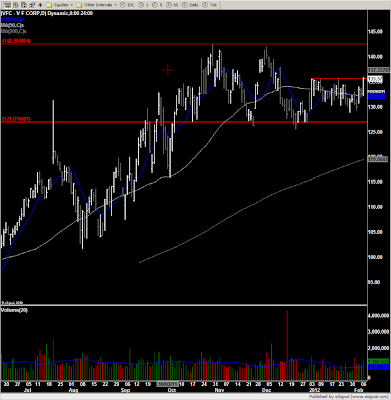


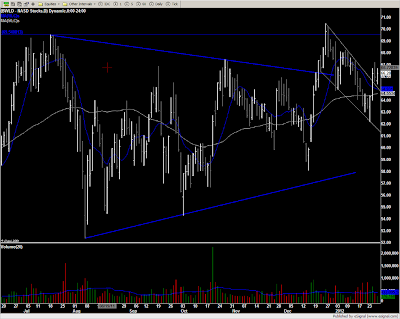

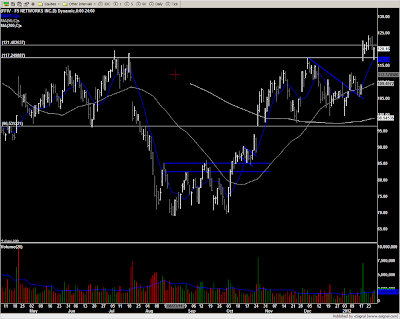

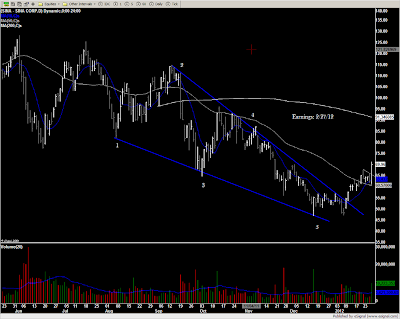

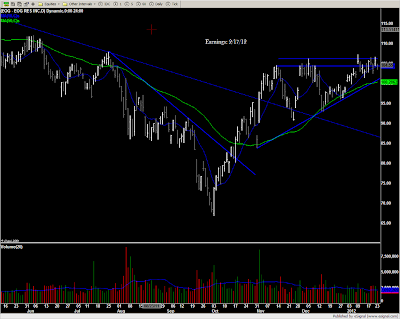
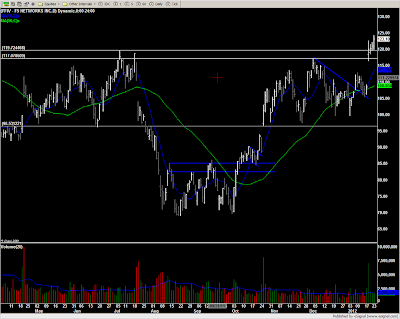
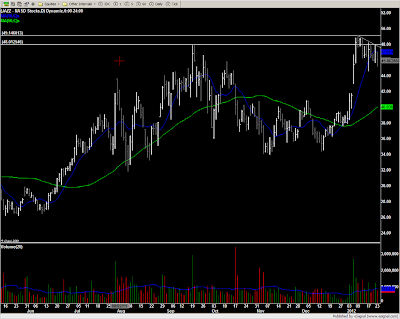
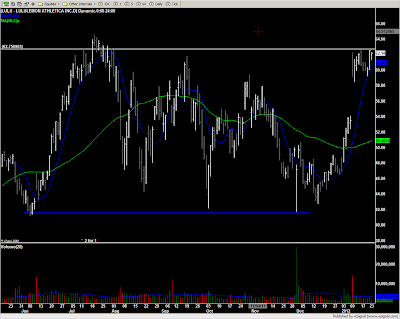


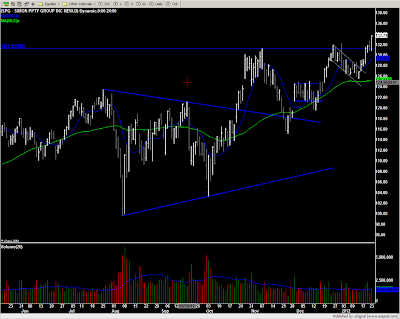
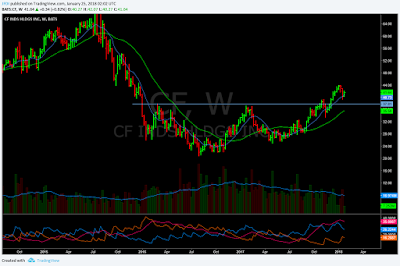
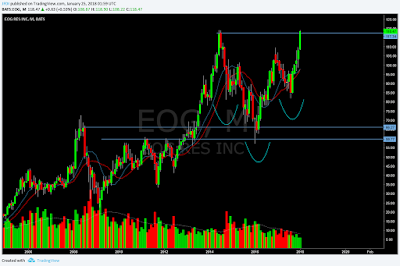
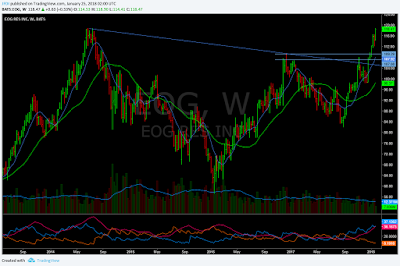
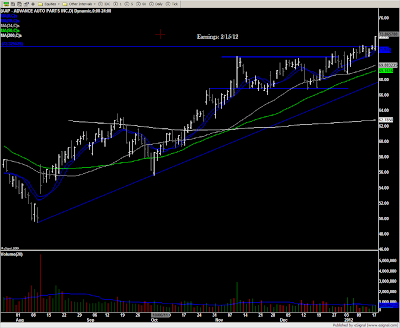
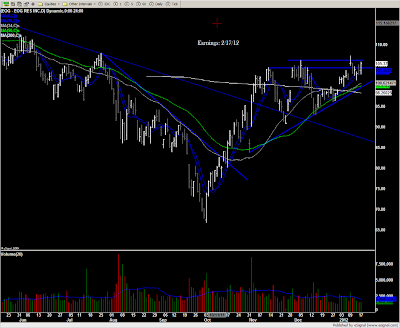
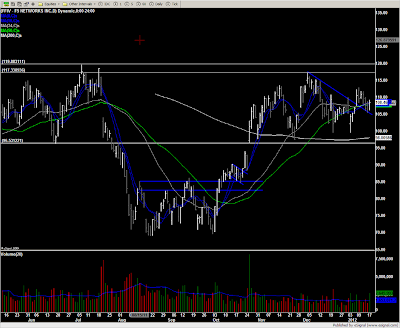
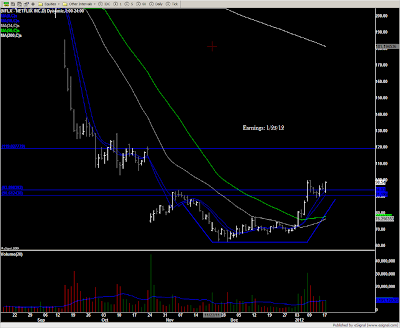
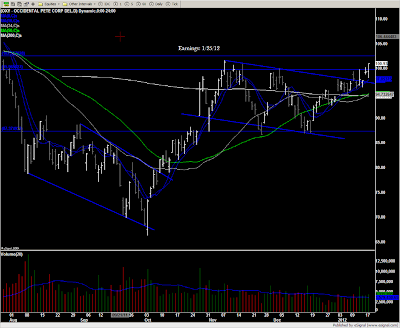
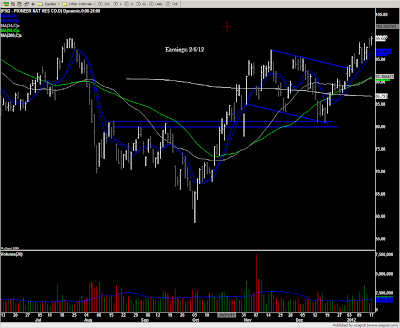
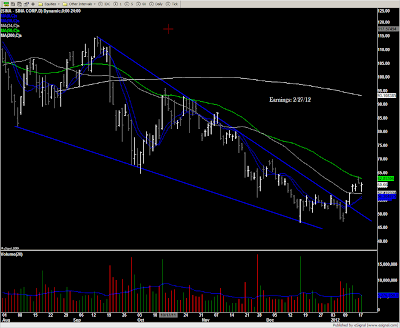
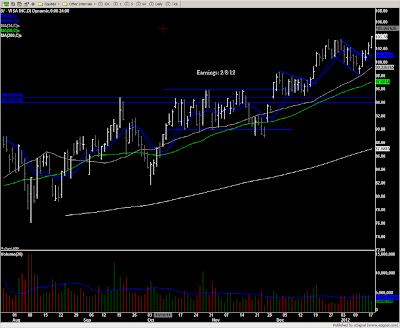
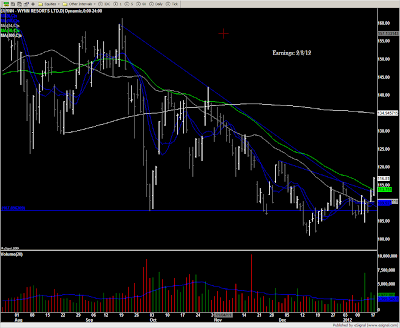
Charts of Interest - $AAP $CAT $CF $EOG $FFIV, Etc...(With Earnings Dates)
A few of the names I am watching/trading with earnings dates posted on the charts. Earnings dates taken from Yahoo Finance, but will double check with other sources. Click on the chart to enlarge.
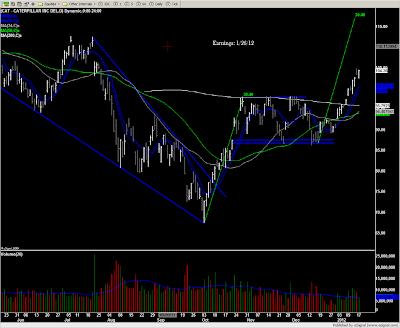
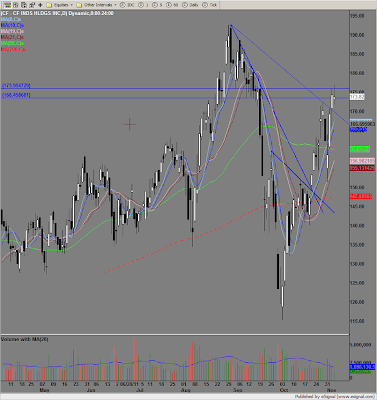
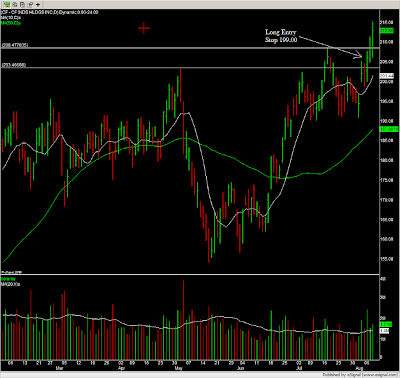
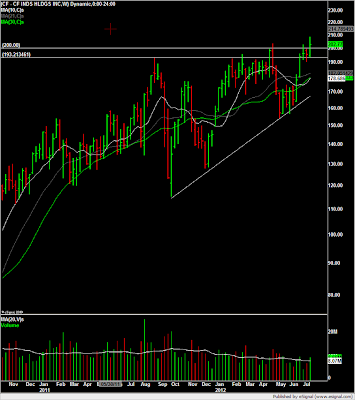
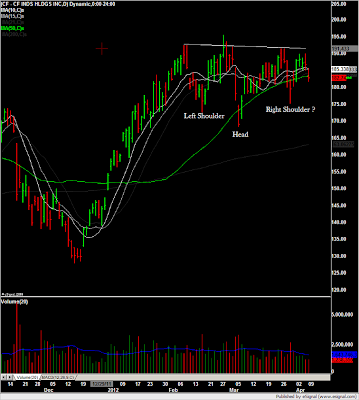
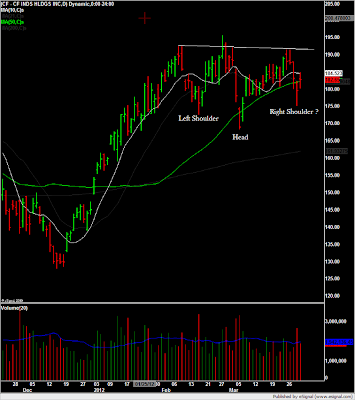
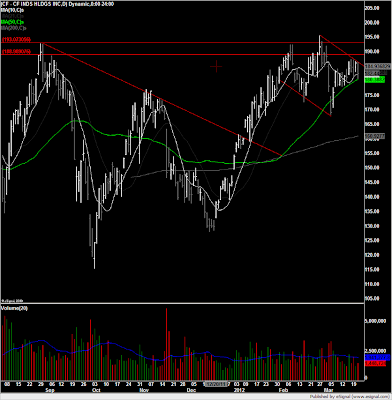
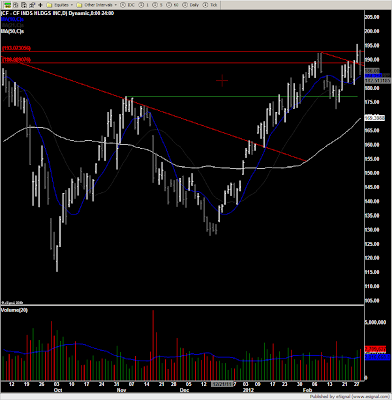
$CF - Trade Review
I originally entered a swing in CF yesterday on the gap and go above this descending trend line. Ideally, I wanted to see the gap hold, so I put my stop a little below the low of the day. Unfortunately, this morning I was stopped out at a loss.
Looking again at the daily chart I wanted to see if this descending trend line that was previous resistance would hold or if the break out would fail all together. Not wanting to get away from CF, I decided to drop down to my 5 min to look for a re-entry, and use my intraday leverage to gain some cushion as well as make back the loss I took being stopped out. Not the best mind set, but I was focused nonetheless.
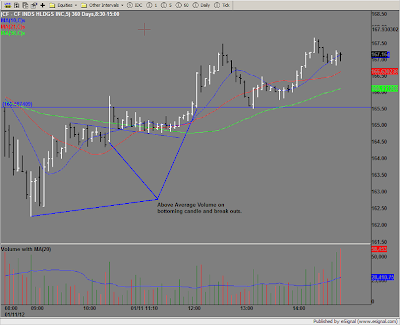
Intraday, CF offered a few different opportunities to add and take off risk. Take a look at the 5min. Volume was actually declining on the move down with two huge volume bars at 8:45am and 9:00am, then again at 9:15am. I waited for confirmation and entered a long position at 9:20am at 163.80, putting my stop under the low of that candle at 162.50. While, CF is probably not anyone's first choice to day trade, it did act well the remainder of the day. A few things I took notice to...
1. Volume increased at the bottom to the upside
2. Volume increased and was above average on break outs
3. Once the morning high was broken at 12:10pm, it held at 1:15am on strong volume.
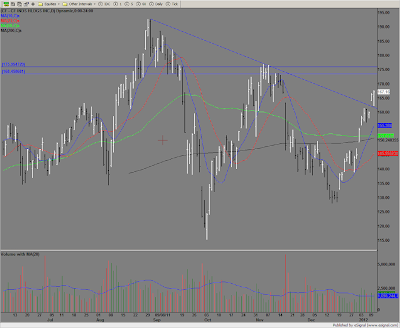

Looking again at the daily chart I wanted to see if this descending trend line that was previous resistance would hold or if the break out would fail all together. Not wanting to get away from CF, I decided to drop down to my 5 min to look for a re-entry, and use my intraday leverage to gain some cushion as well as make back the loss I took being stopped out. Not the best mind set, but I was focused nonetheless.
Intraday, CF offered a few different opportunities to add and take off risk. Take a look at the 5min. Volume was actually declining on the move down with two huge volume bars at 8:45am and 9:00am, then again at 9:15am. I waited for confirmation and entered a long position at 9:20am at 163.80, putting my stop under the low of that candle at 162.50. While, CF is probably not anyone's first choice to day trade, it did act well the remainder of the day. A few things I took notice to...
1. Volume increased at the bottom to the upside
2. Volume increased and was above average on break outs
3. Once the morning high was broken at 12:10pm, it held at 1:15am on strong volume.
CF Daily
CF 5min
CF 1min
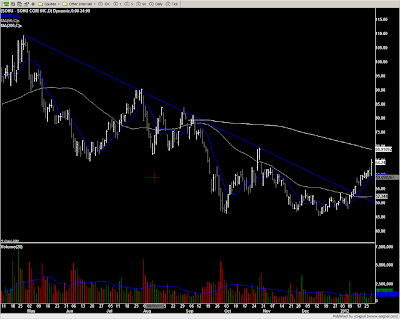
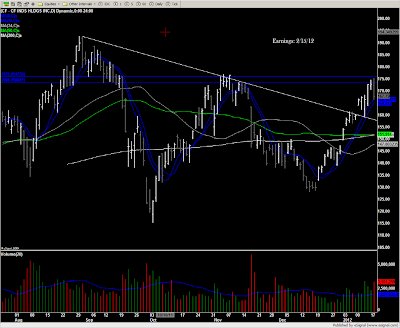
Charts of Interest - $AAP $CAT $CFX $CXO $DG $HLF $HMSY etc...
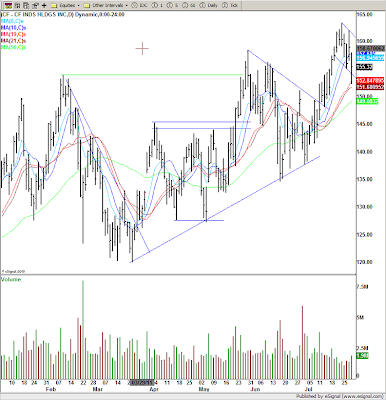
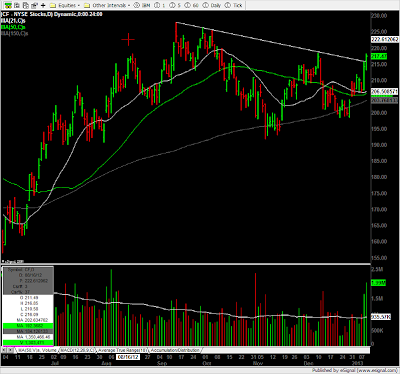
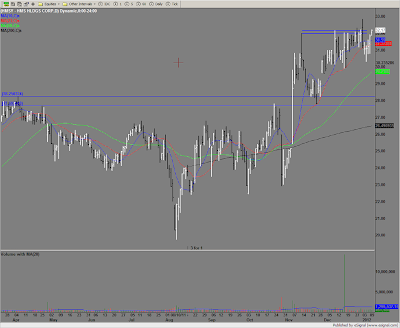
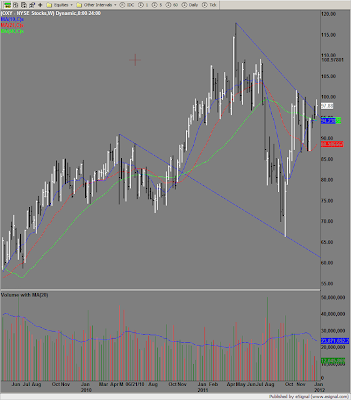
A few names that were mentioned in IBD today such as CFX and IHS, both caught my attention. If you look at the weekly chart of CFX, it has been under accumulation since late October. IHS also mentioned just cleared its 90 area soaring to new all time highs on about 4x average volume.
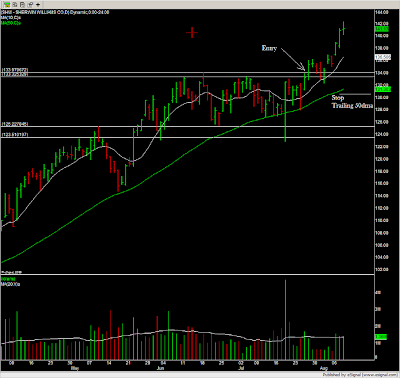
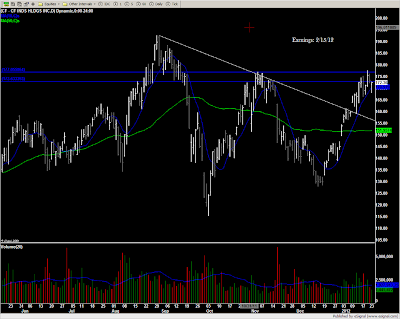
HLF was looking like a great short as it flagged underneath the 200dma, although breaking out to the upside today thru its 200dma, which for almost a month was finding as resistance. The descending wedge suggests a measured move back to where the pattern originated at highs 63.40ish. A move thru the 50d may provide another entry.
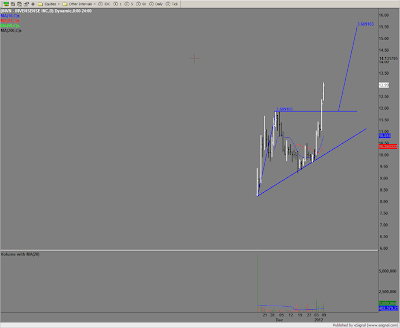
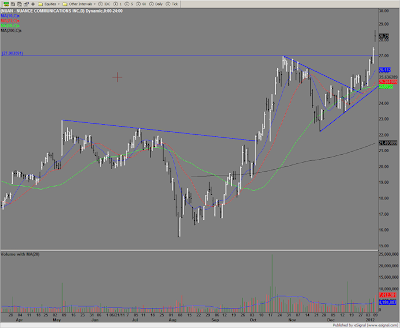
@Flare9x and @ABTrader brought NUAN and INVN to my attention which I entered yesterday. Both working well. INVN moving higher on strong volume.
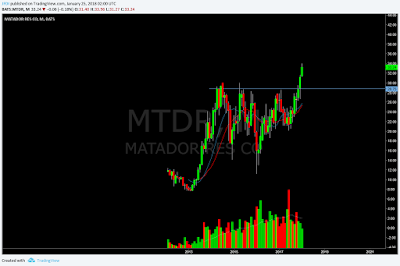
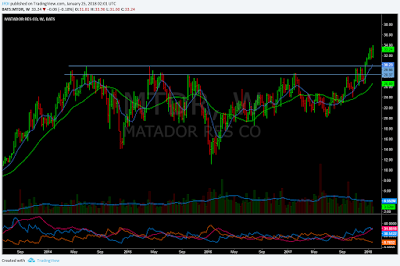
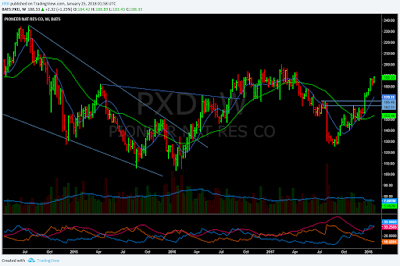
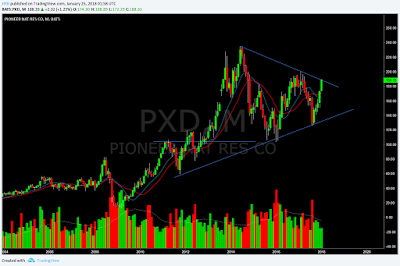
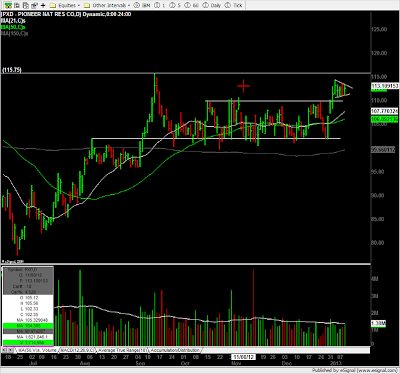
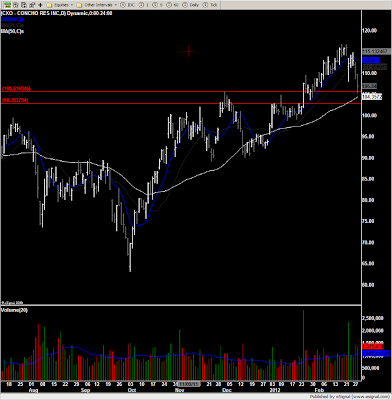
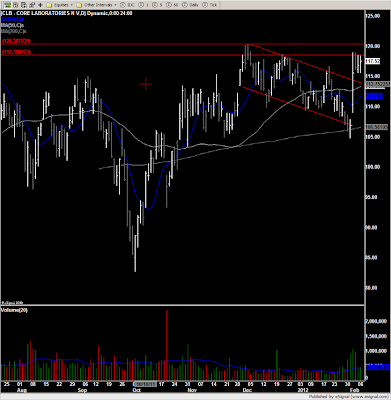
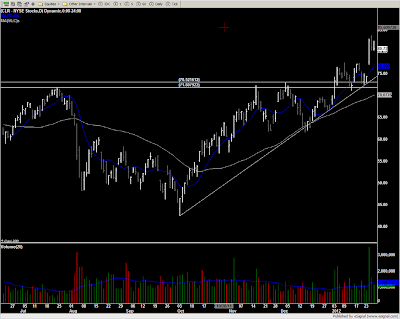
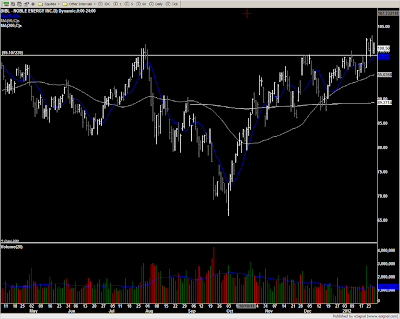
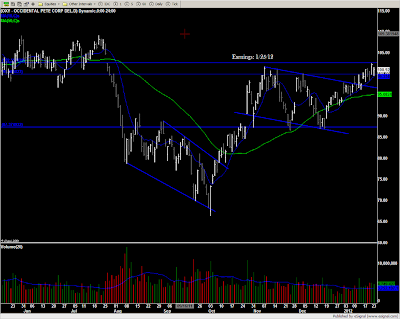
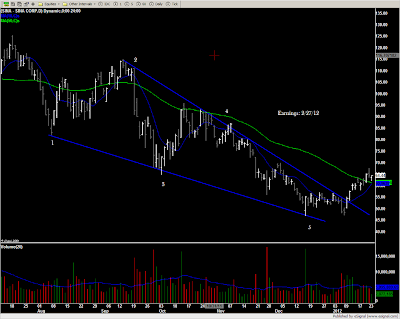
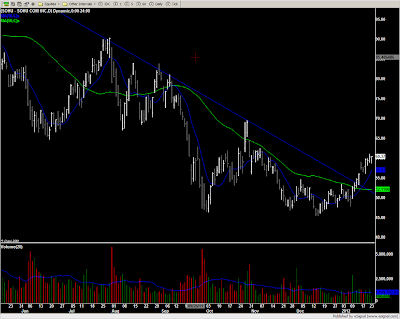
My favorites remain OXY, EOG, APA, APC, DVN, PXD, NOV, CXO, CLR, and for a cheap one EPM is setting up nicely.
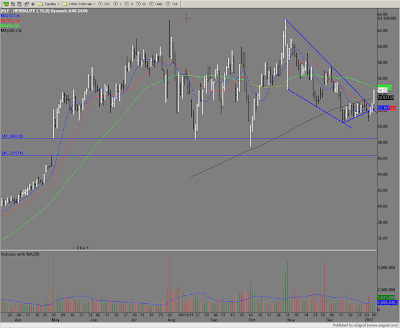
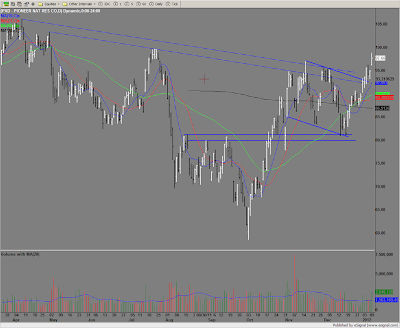
HLF was looking like a great short as it flagged underneath the 200dma, although breaking out to the upside today thru its 200dma, which for almost a month was finding as resistance. The descending wedge suggests a measured move back to where the pattern originated at highs 63.40ish. A move thru the 50d may provide another entry.
@Flare9x and @ABTrader brought NUAN and INVN to my attention which I entered yesterday. Both working well. INVN moving higher on strong volume.
My favorites remain OXY, EOG, APA, APC, DVN, PXD, NOV, CXO, CLR, and for a cheap one EPM is setting up nicely.
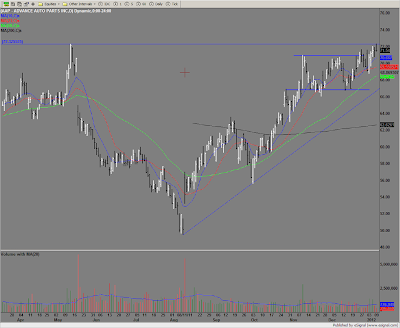
AAP Daily
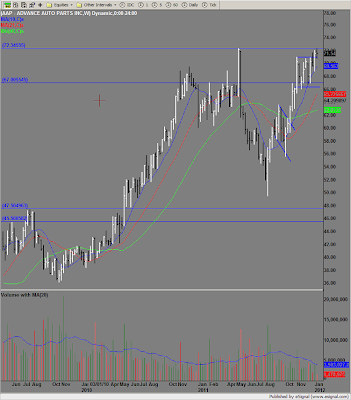
AAP Weekly
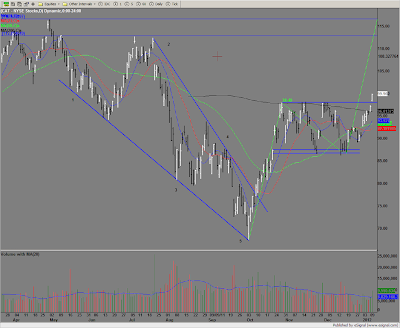
CAT Daily
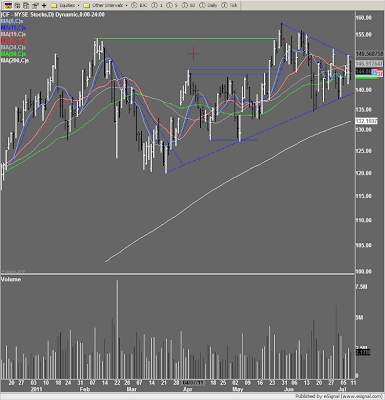
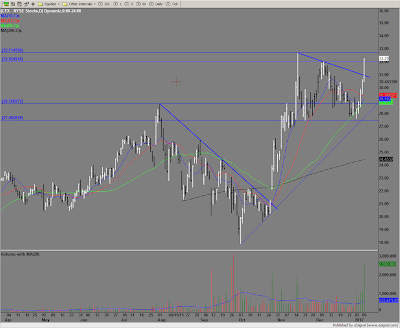
CFX Daily
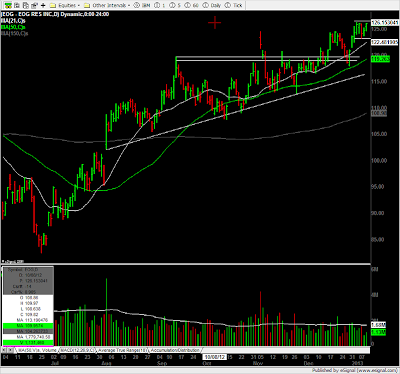
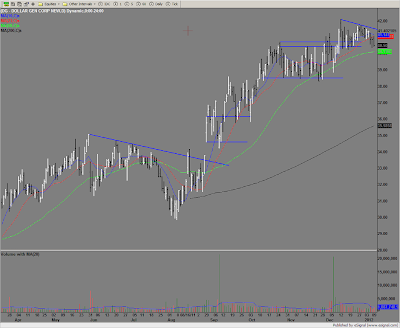
DG Daily
HLF Daily
HMSY Daily
IHS Daily
INVN Daily
NUAN Daily
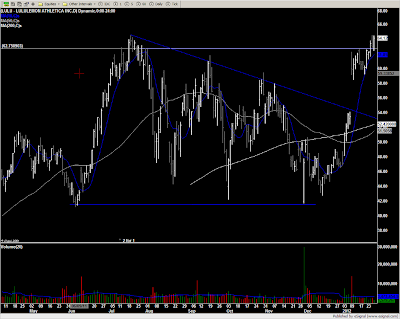
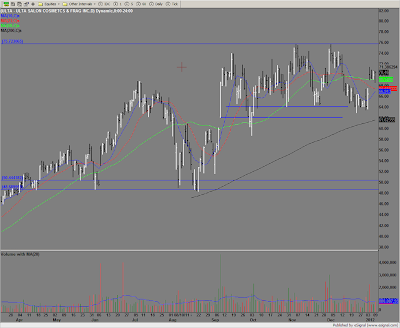
ULTA Daily
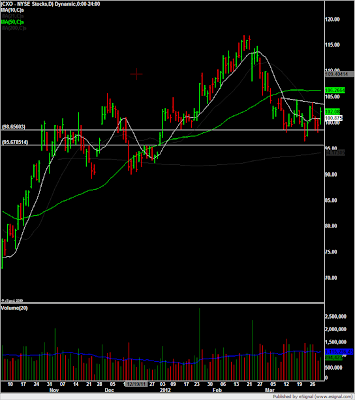
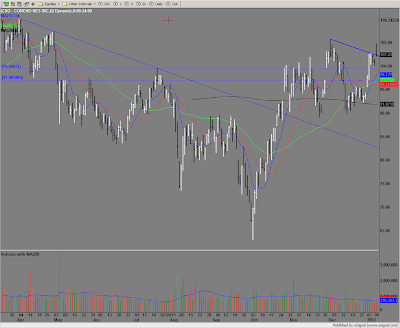
CXO Daily
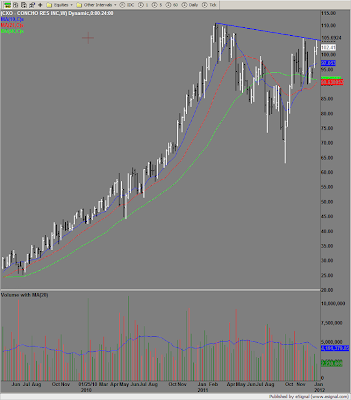
CXO Weekly
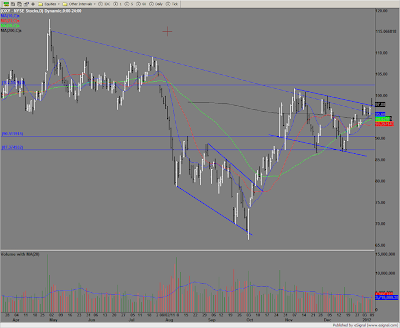
OXY Daily
OXY Weekly
PXD Daily
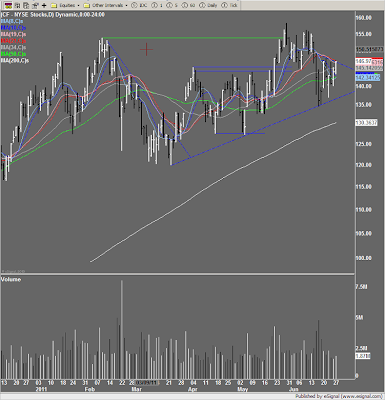
CF Daily